

Single session data
Once a broadcast ends, its full data lives on this page. Two ways in: View details from the Details table, or View details on the event card.
The top bar
Section titled “The top bar”The first line is the broadcast’s name, followed by an Ended marker. Duration, date, and time zone sit below.
Two controls on the right:
- Attribution window — how far forward transaction figures track. This is the same setting as on the analytics page. Change it in either place and the other follows. See Attribution rules.
- Full screen — fills the screen, which suits reviewing on a big display.
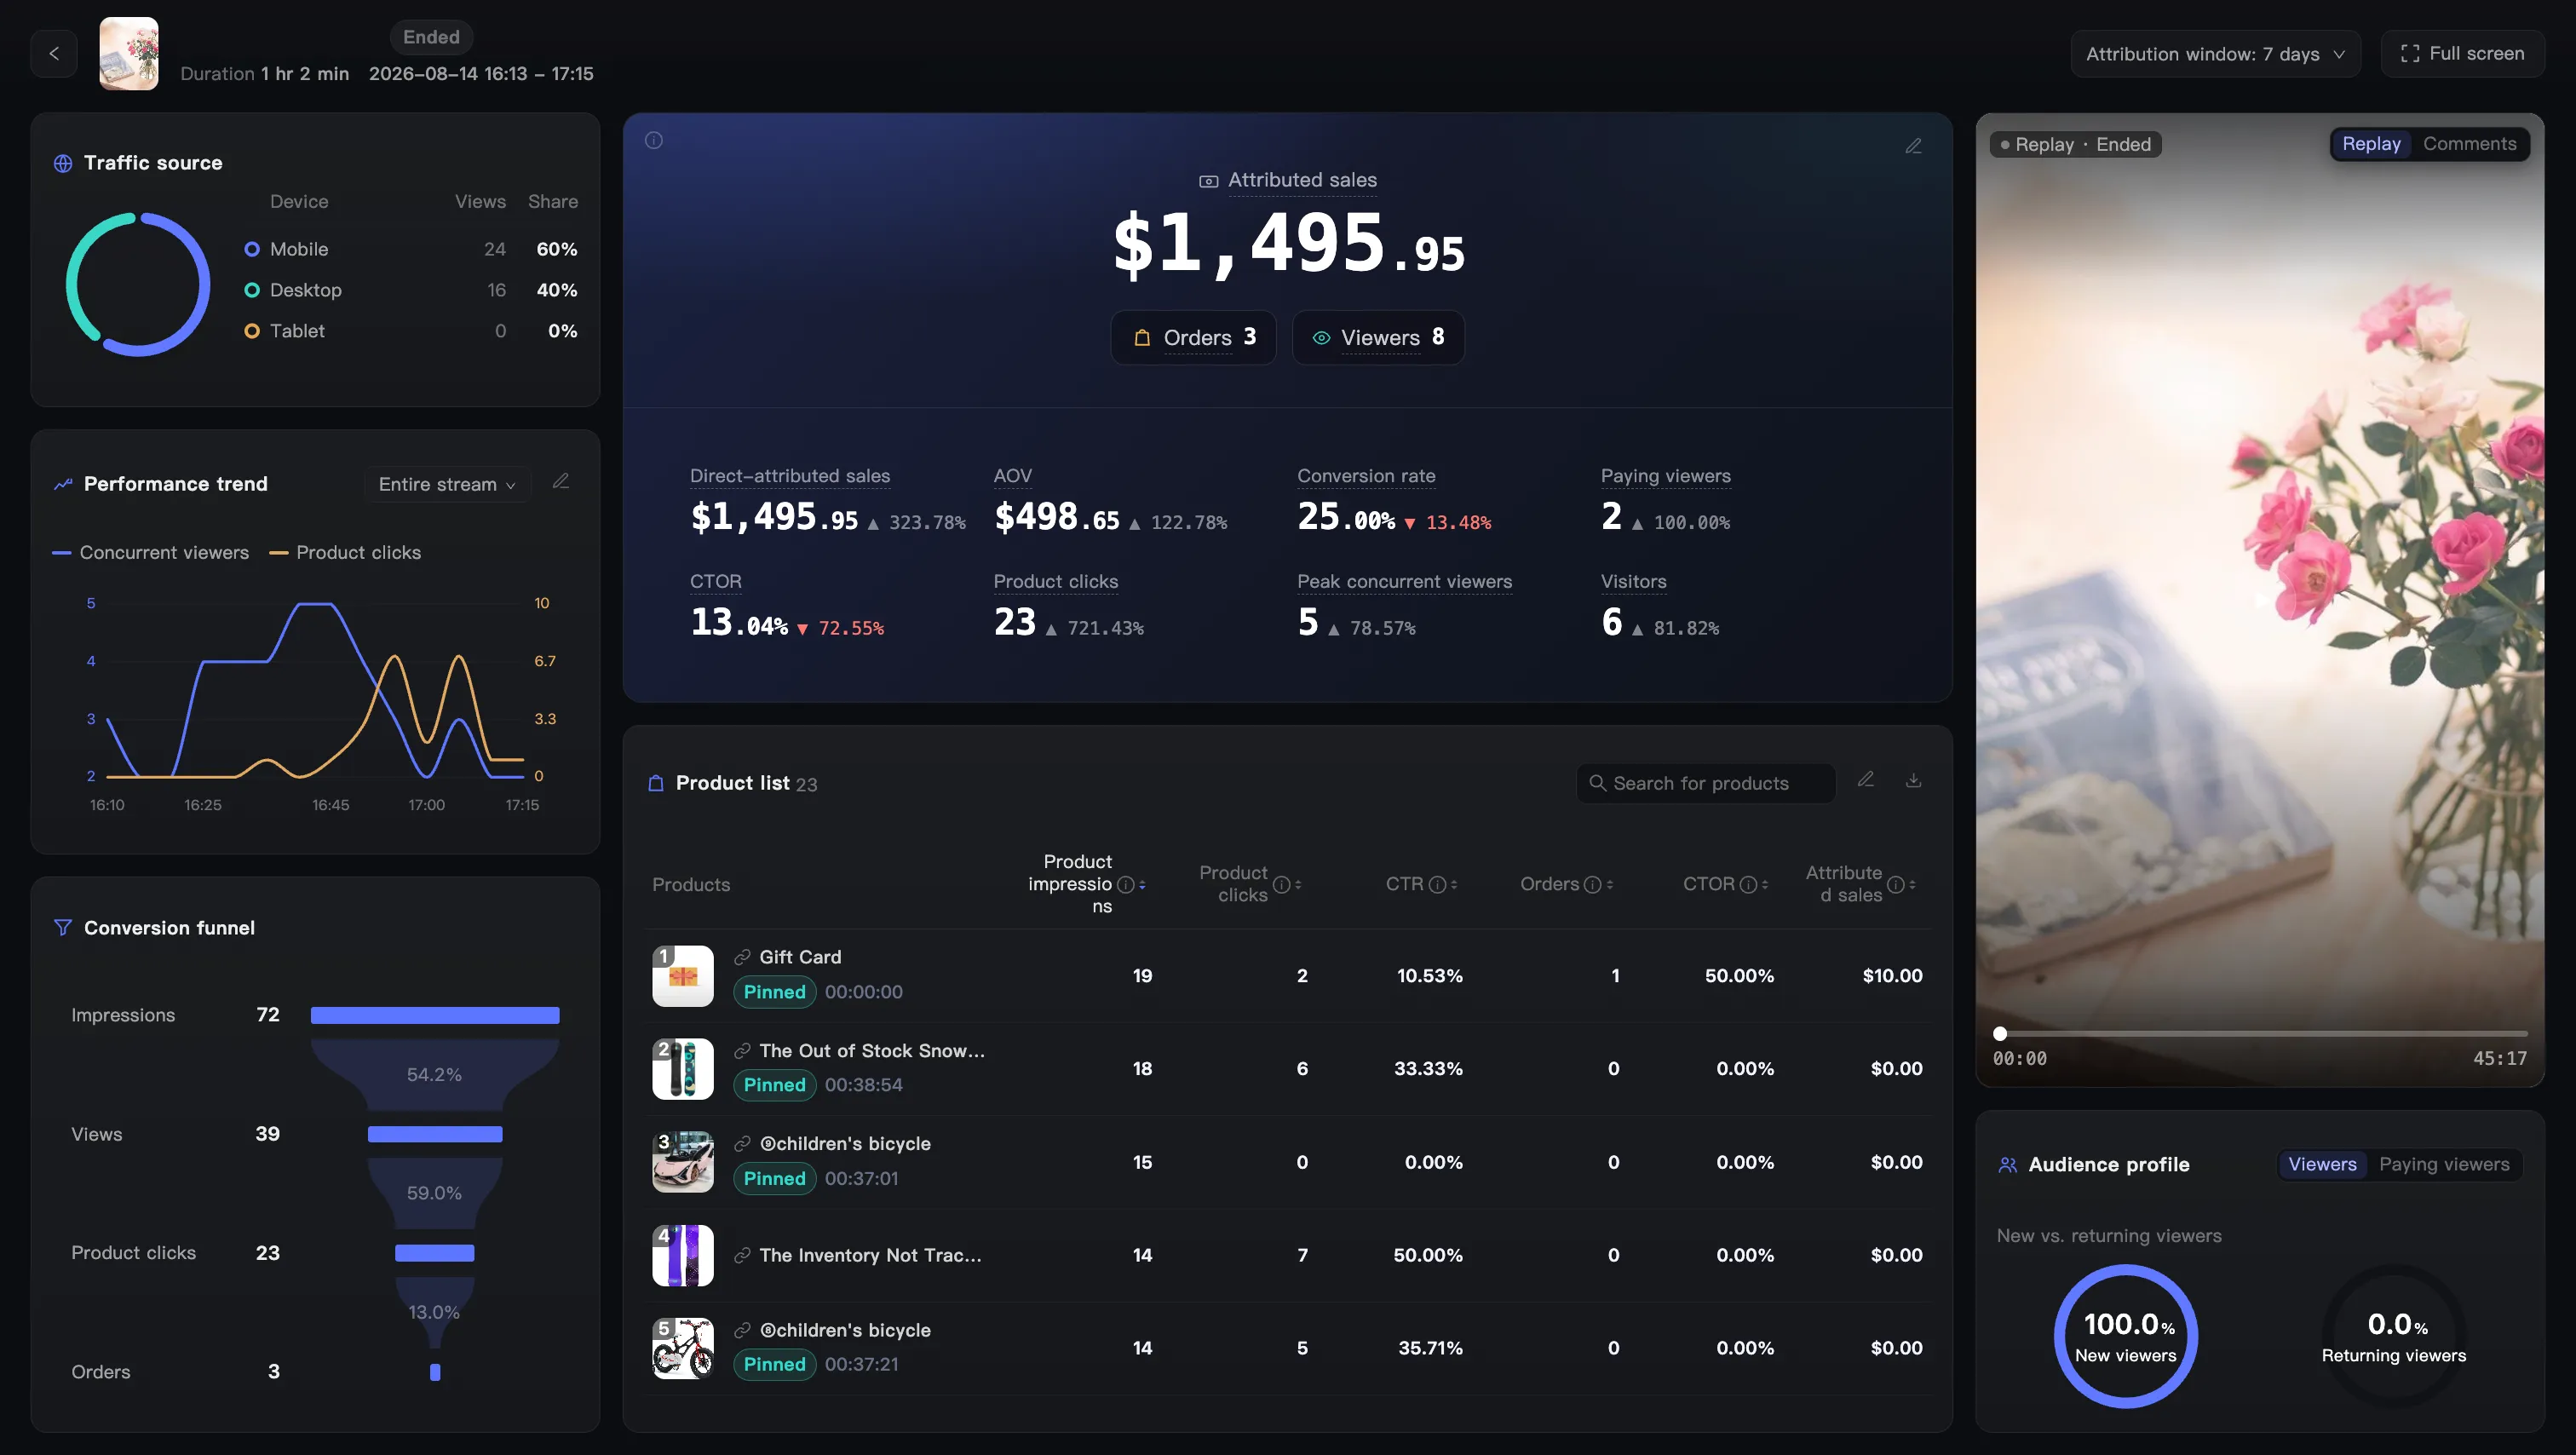
Three columns
Section titled “Three columns”Traffic and conversion on the left, metrics and products in the middle, replay and audience makeup on the right.
Traffic source
Section titled “Traffic source”A device donut splits this session’s views across mobile, desktop, and tablet. Views and share for each sit beside it.
Performance trend
Section titled “Performance trend”A minute-by-minute curve across the broadcast.
- Choose metrics — click the pencil icon. You can plot simultaneous online audience, product clicks, new viewers, product exposure, orders, and contributed revenue. Two lines at most, one per Y axis. Pick a third and the oldest line drops off.
- Choose a window — the dropdown at the top right switches between Entire stream, the last hour, the last 30 minutes, and the last 5.
- Read one moment — moving the pointer across the chart draws a vertical line and a readout bubble with every metric’s value at that instant.
- Jump to that point in the replay — click the chart and the replay player on the right seeks there. Spot a minute where the audience fell off and go watch what you were saying.
Conversion funnel
Section titled “Conversion funnel”Four levels, Impressions to Views to Product clicks to Orders, with the conversion rate between each. Use it to find the step that loses the most.
Changing the attribution window only moves the last level. The first three are behaviour during the broadcast and have nothing to do with attribution.
Core metrics
Section titled “Core metrics”The middle column opens with Attributed sales in large type, with Orders and Viewers beside it. Below sits a set of metric cards. Eight by default: Direct-attributed sales, AOV, Conversion rate, Paying viewers, CTOR, Product clicks, Peak concurrent viewers, and Visitors.
Each card carries a percentage change on the right. It compares this session with the average of your last 10 broadcasts, not with the previous one. Among the metrics on show, the three furthest below average turn red, to point you at those first.
Click the pencil icon at the top right to change metrics. Pick from four groups on the left: transaction, traffic, product interaction, and in-room interaction. The selected list on the right drags to reorder, and each entry removes with its cross. Sixteen at most, one at minimum. A default button restores the original eight. Save when you are done.
For what each metric means, see Metrics glossary. The info icon beside each name in the picker says the same thing.
Product list
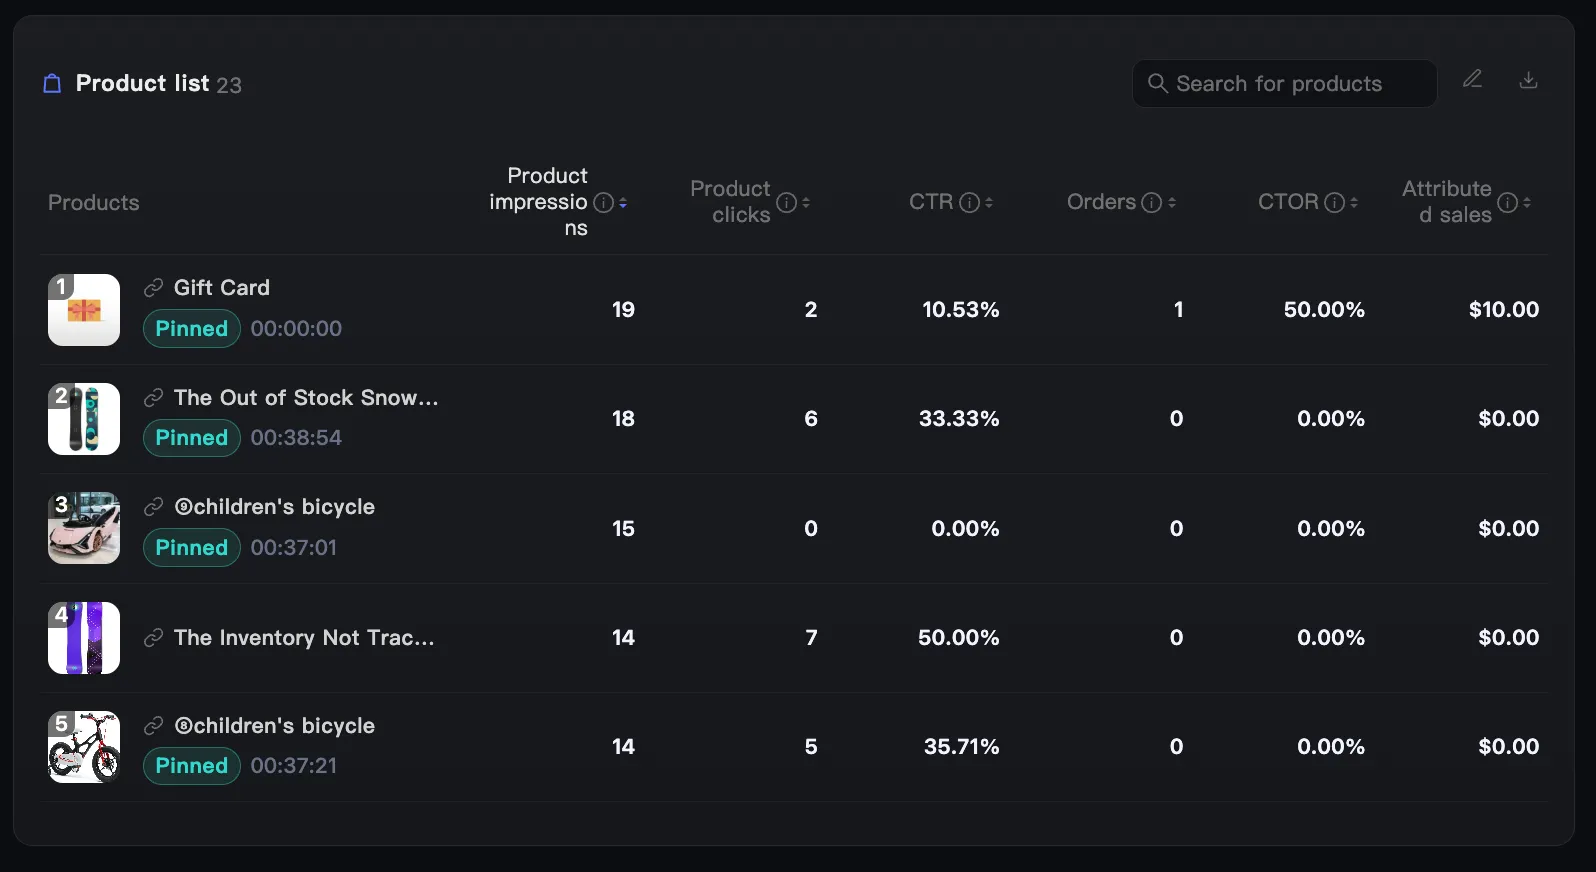
Section titled “Product list”How every product in this broadcast performed. The number beside the title is the product count.
Each row opens with the product thumbnail carrying a rank badge, the product name, and an icon that opens the product link. Products you pinned carry a Pinned badge and the time you pinned them. Read that against the trend chart and you can see whether pinning drew clicks.
Default columns are Product impressions, Product clicks, CTR, Orders, CTOR, and Attributed sales. Click any header to sort. Three icons at the top right search products, customize columns, and export:
- Customize columns — the same interaction as customizing metrics. Ten columns available, drag to reorder, one at minimum.
- Export — queues an export task. See Export data.
Replay and comments
Section titled “Replay and comments”The top of the right column switches between Replay and Comments.
- Replay — this session’s recording, with a scrubber. Clicking the trend chart seeks it.
- Comments — the chat log for this broadcast, each entry timestamped, with host messages marked.
Audience profile
Section titled “Audience profile”Switch between Viewers and Paying viewers. Each splits into New viewers and Returning viewers to show the mix.
The two splits do not read the same data:
- New and returning viewers — based on MaxxShow’s own viewing records. Anyone who appears in those records counts as returning. Anyone appearing for the first time counts as new. There is no time window.
- New and returning customers — based on your store’s customer data. Anyone who has ordered from your store before counts as returning, and a first-time buyer counts as new. It judges whether they have bought from this store, not whether they bought through a broadcast.
So the two sets will not line up, and you should not check one against the other. Someone who has browsed your store, bought something, and is watching a broadcast for the first time is both a new viewer and a returning customer.