Single replay data
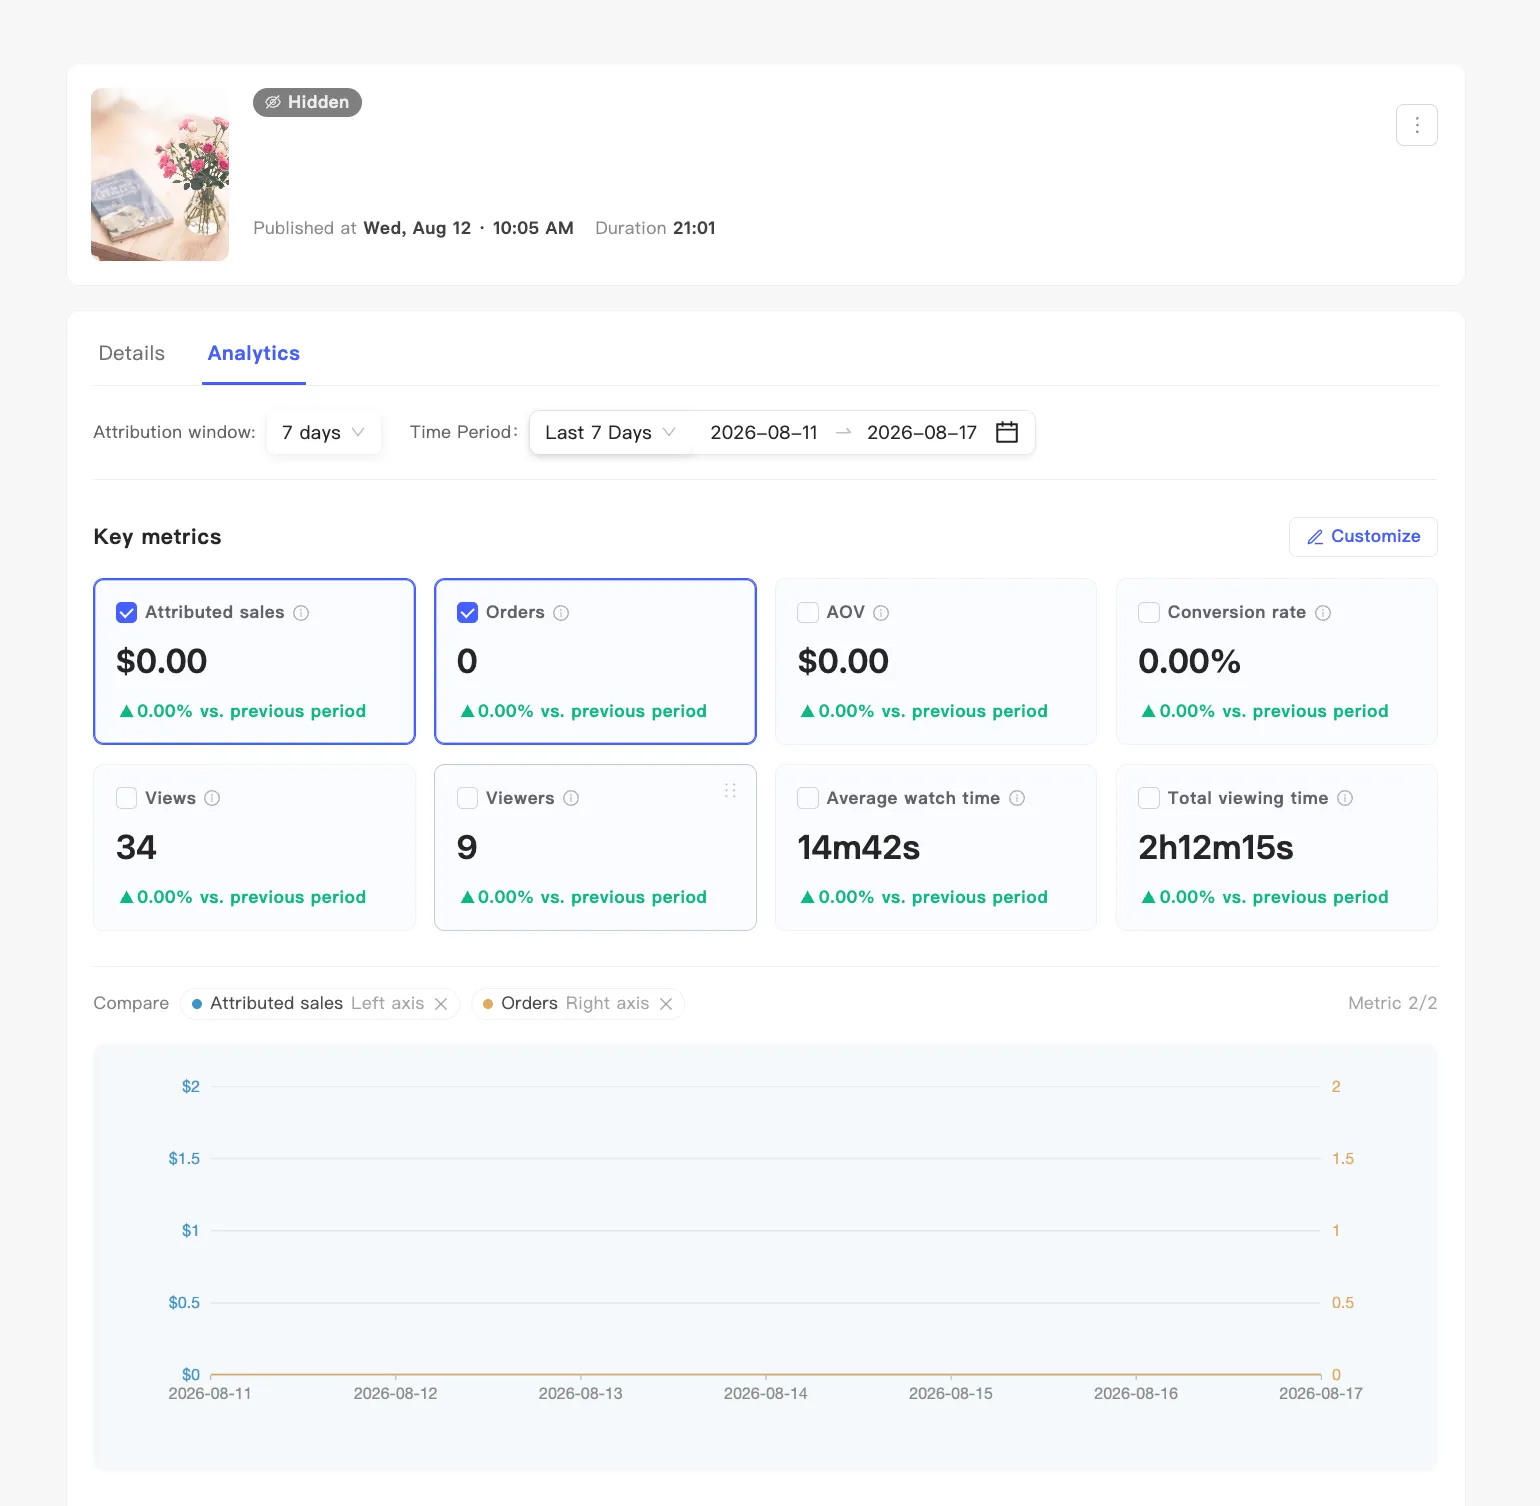
A replay’s full data sits under the Analytics tab of its detail page.
Getting there
Section titled “Getting there”Open the replay’s detail page first. Either route works:
- View details on the replay card in replay management
- View details in the replay Details table under analytics
The page carries two tabs, Details and Analytics. Switch to Analytics.
How this differs from a live session
Section titled “How this differs from a live session”Replay data keeps accumulating. A broadcast happens once. A broadcast is frozen the moment it ends. A replay hangs on your shopping page and picks up viewers tomorrow.
So this page has one filter that Single session data does not: Time Period. Use it to see how this replay did over a given stretch. A live session only has the attribution window.
This page also drops the audience profile and comments.
Filters
Section titled “Filters”Two at the top:
- Attribution window — how long after a view an order still counts towards this replay. See Attribution rules.
- Time Period — which stretch of time you are looking at. Presets, or your own start and end dates.
Both are the same settings as on the analytics page. Change either one in one place and the other place follows.
key metrics
Section titled “key metrics”Eight by default: Attributed sales, Orders, AOV, Conversion rate, Views, Viewers, Average watch time, and Total viewing time. Each card carries a month-on-month change.
Click the pencil icon to change metrics, picking from three groups: transaction, traffic, and product interaction. The cards drag to reorder.
Click a card to select it and the chart below plots it. Two at most, one at minimum.
Changing the attribution window only moves some of these numbers. Revenue figures, orders, and paying viewers follow the window. Impressions, visitors, views, viewers, watch time, and product impressions and clicks do not. Those count viewing behaviour itself.
For what each metric means, see Metrics glossary.
Conversion analysis
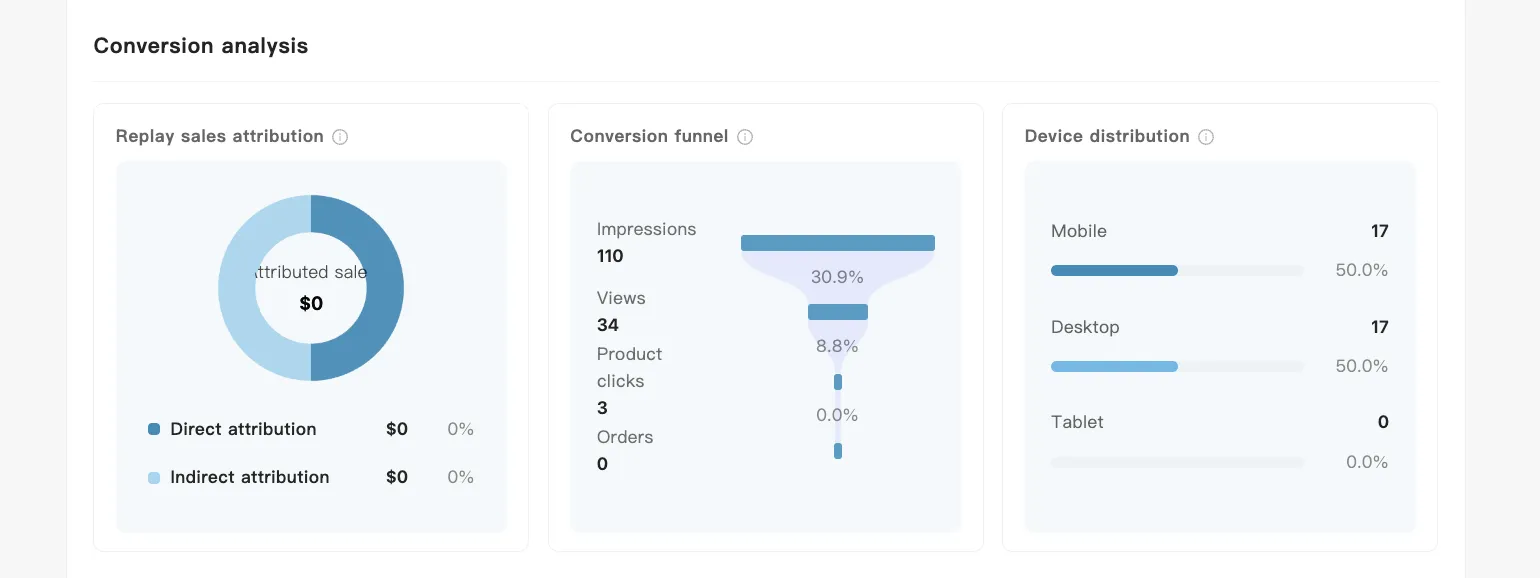
Section titled “Conversion analysis”Three cards side by side:
Replay sales attribution — a donut whose legend splits Direct attribution from Indirect attribution.
- Direct attribution — they bought a product the replay showed.
- Indirect attribution — the replay led them there, but they bought something else.
Direct attribution splits further into inside and outside the replay: buying within the replay counts as inside, finishing elsewhere afterwards counts as outside. The donut legend does not break those out. To see them, add replay internal revenue and replay export revenue to your key metrics.
Conversion funnel — Impressions to Views to Product clicks to Orders, with the conversion rate between each. Impressions here count how often the replay appeared on your shopping page.
Device distribution — device share for this replay by views.
Product list
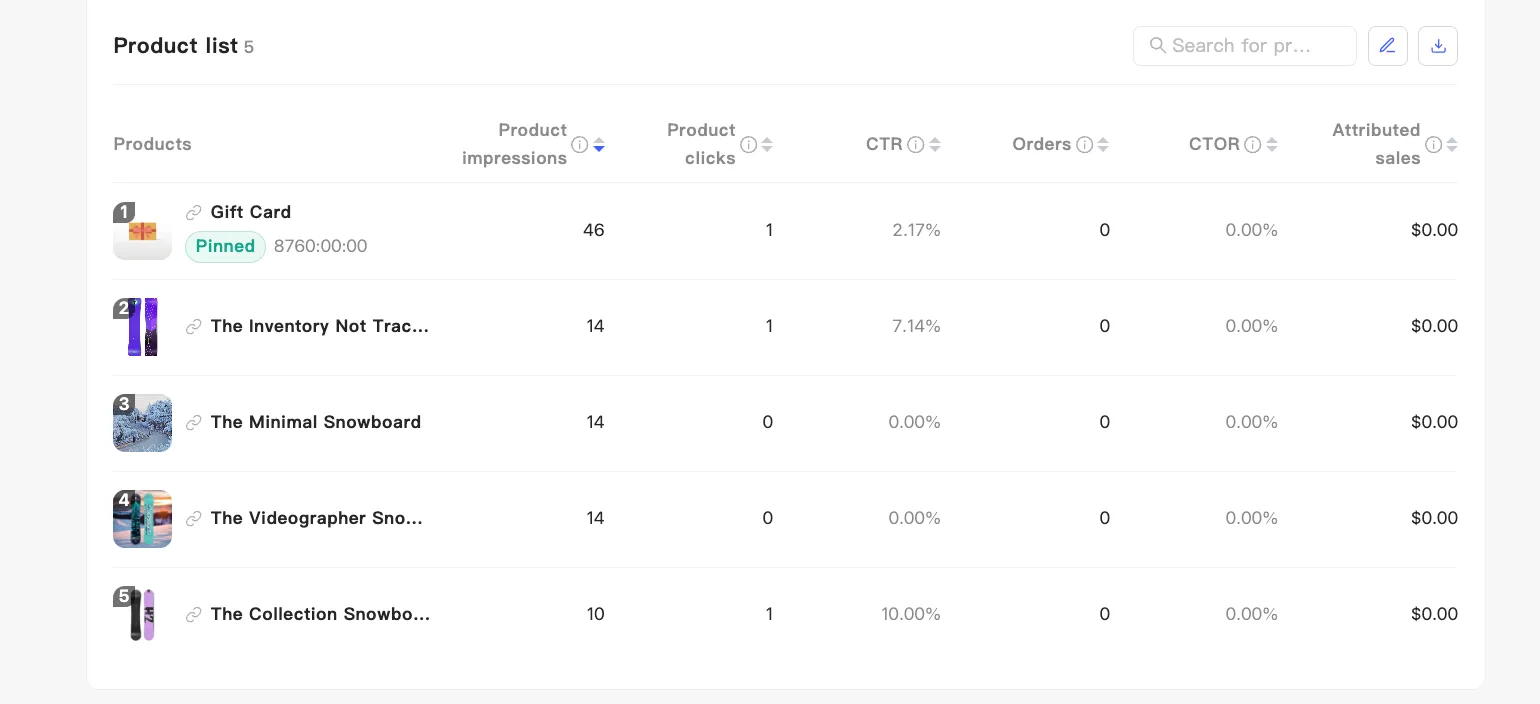
Section titled “Product list”How every product in this replay performed. The number beside the title is the product count.
Products you pinned during the broadcast carry a Pinned badge and pin timestamp here too.
Default columns are Product impressions, Product clicks, CTR, Orders, CTOR, and Attributed sales. Click any header to sort.
Three icons at the top right search products, customize columns, and export:
- Customize columns — ten columns available in the same three groups, and they drag to reorder.
- Export — queues an export task. See Export data.